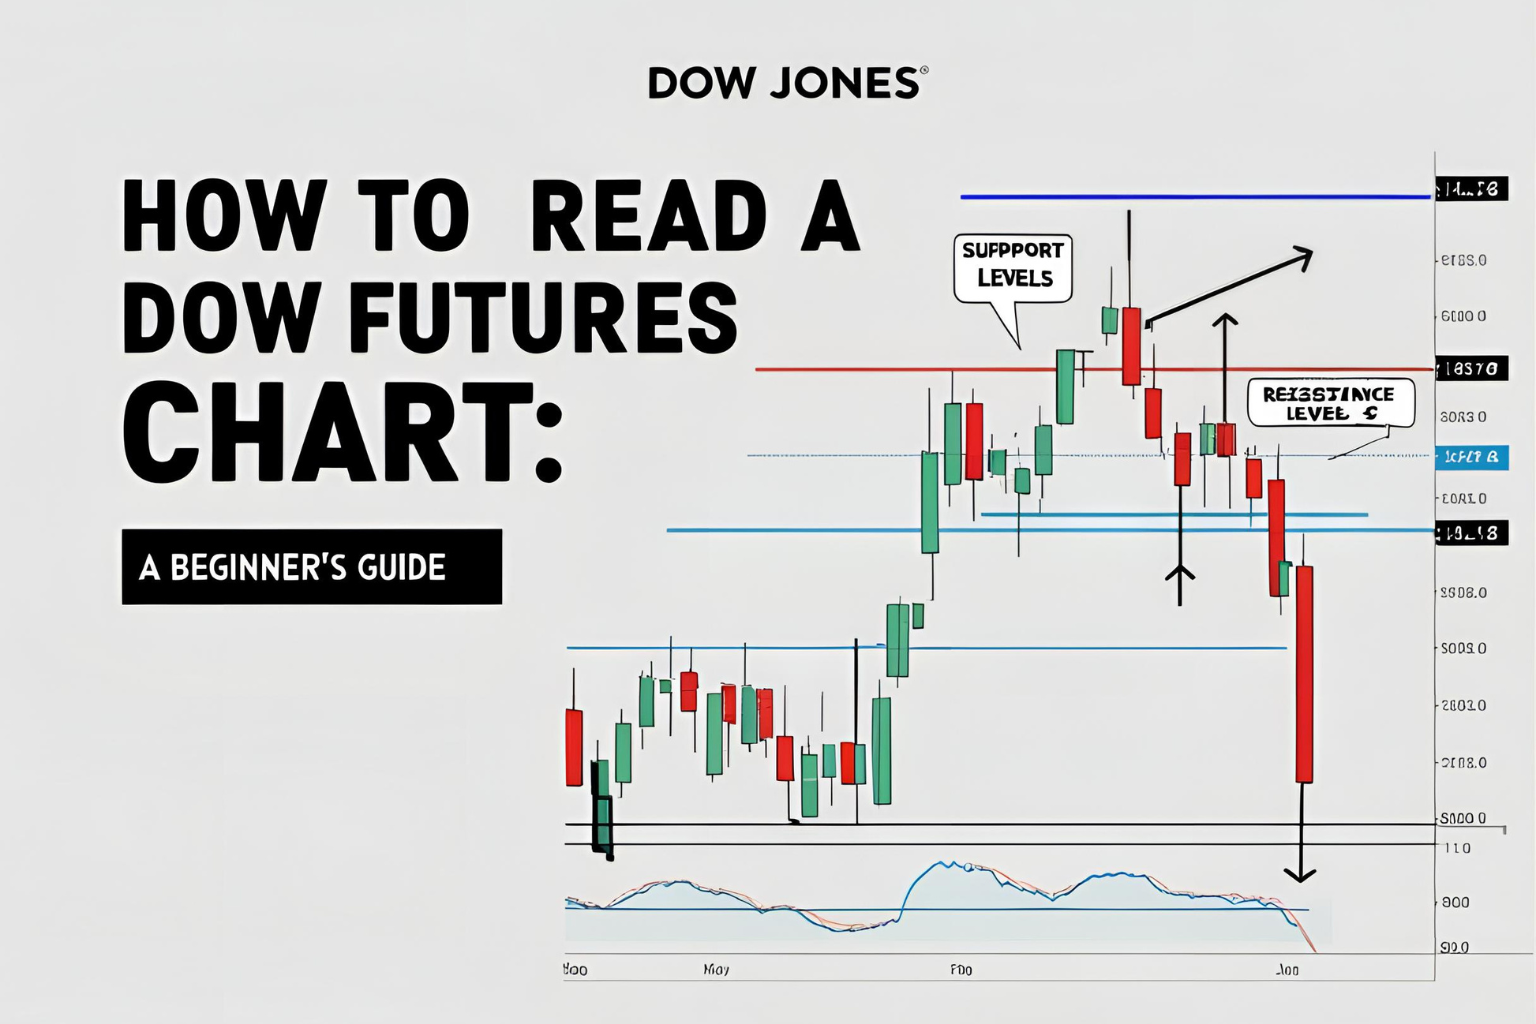
How to Read a Dow Futures Chart: A Beginner’s Guide
Introduction
If you’re new to DJIA futures trading, reading a chart might seem overwhelming at first. But understanding a Dow Jones futures chart is essential for making smart trading decisions. In this beginner’s guide, we’ll explain what these charts show, how to interpret them, and which key features you should pay attention to—without using complex jargon.
What Is a Dow Futures Chart?
A Dow futures chart visually represents the price movements of DJIA futures contracts over a selected period. These charts help traders understand market trends, identify entry and exit points, and monitor volatility.
You can access Dow futures charts on popular platforms like:
- CME Group
- TradingView
- Yahoo Finance
- ThinkorSwim
- NinjaTrader
Types of Charts You’ll Encounter
There are several chart types used in futures trading, but the three most common are:
- Line Chart:
Displays closing prices over time. Ideal for quick trend analysis. - Bar Chart:
Shows the open, high, low, and close (OHLC) for each time period. - Candlestick Chart:
Widely used due to its visual clarity. Each candle shows the open and close (body), and the high and low (wicks).- A green candle indicates the price closed higher than it opened.
- A red candle means the price closed lower than it opened.
Timeframes Matter
Dow futures charts can display different time intervals, such as:
- 1-minute: For scalpers and high-frequency traders
- 5-minute to 30-minute: For intraday traders
- 1-hour to daily: For swing and position traders
As a beginner, start with daily or 4-hour charts to spot trends more easily.
Key Chart Components Explained
Understanding the layout of your chart helps you interpret data better. Here’s what to look for:
- Price axis (vertical): Shows the current and historical price levels.
- Time axis (horizontal): Displays the selected timeframe or date range.
- Volume bars: Indicate the number of contracts traded at each interval (if enabled).
- Indicators and overlays: Optional tools like moving averages or RSI.
Simple Patterns to Recognize
You don’t need to master technical analysis immediately. But watching for these basic patterns can help:
- Uptrend: A series of higher highs and higher lows.
- Downtrend: A series of lower highs and lower lows.
- Sideways (Range): Price fluctuates within a flat range.
Spotting these can help you decide whether to enter or wait.
Useful Indicators for Beginners
Here are a few simple, effective tools to layer onto your chart:
- Moving Averages (MA):
Smooth out price action and reveal trend direction. Start with a 50-period Simple Moving Average (SMA). - Relative Strength Index (RSI):
Helps you identify overbought (above 70) and oversold (below 30) conditions. - Support and Resistance Lines:
Mark price levels where movement tends to pause or reverse.
Use only one or two indicators at a time to avoid chart clutter.
How to Read a Dow Futures Chart Step by Step
- Select the right timeframe based on your trading goals.
- Identify the trend direction—up, down, or sideways.
- Observe candlestick colors and patterns to see momentum shifts.
- Use support and resistance levels to estimate entry/exit points.
- Confirm signals with a basic indicator like RSI or Moving Average.
- Watch volume bars for signs of conviction behind moves.
Common Beginner Mistakes to Avoid
- Using too many indicators at once
- Ignoring long-term trends by focusing only on short timeframes
- Making impulsive decisions without confirmation
- Overcomplicating the chart with unnecessary tools
Conclusion
Learning to read a Dow futures chart doesn’t require a financial background. By focusing on simple chart types, trend direction, and a few helpful indicators, you can begin to build confidence and make better-informed trading decisions. With practice, chart reading will become second nature.
FAQs
Q1. What’s the best chart type for beginners?
Candlestick charts are the most informative while still being easy to understand.
Q2. Which timeframe should I choose to start with?
Start with the daily or 4-hour chart to get a clear view of long-term trends.
Q3. Do I need to pay for advanced charting tools?
No. Free platforms like TradingView and Yahoo Finance offer excellent basic charts.
Q4. How do I know when to buy or sell from the chart?
Use trend analysis, support/resistance levels, and simple indicators like RSI to guide your decision.
Q5. Is chart reading alone enough for trading success?
Chart reading is a key skill, but it should be combined with risk management and market awareness.